These metrics describe only the same full-sample display subset shown in the figures; they are not independent external-validation scores. The median relative half-width of the bootstrap 68% CI is 9.53%, with a maximum of 17.91%.
Figure A
Download PDF
ΔC–counts relation at fixed PSF and background
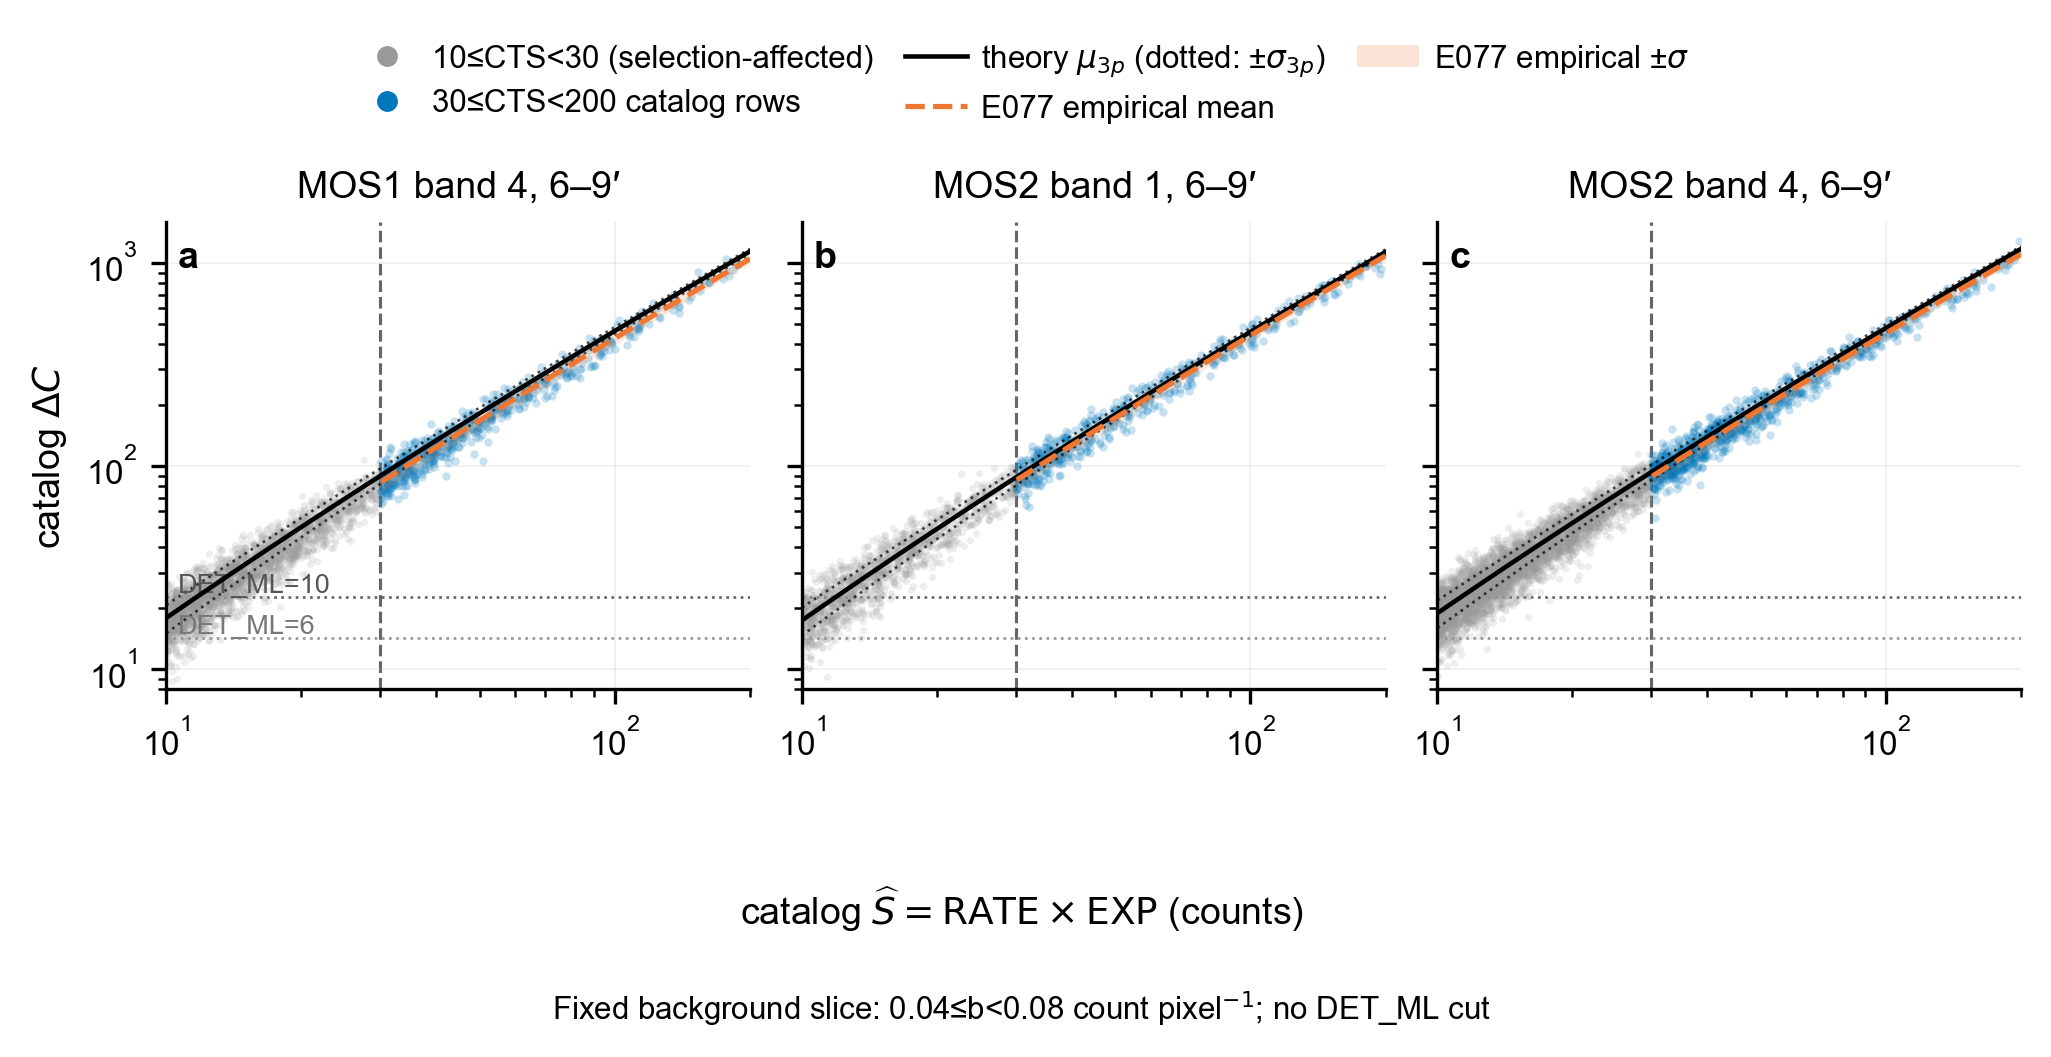
Fixed θ = 6–9′ and 0.04 ≤ b < 0.08 cts/pixel. Gray points are the selection-affected region with 10 ≤ CTS < 30 and are shown for context only; blue points are the primary 30 ≤ CTS < 200 count-selected sample. The black solid and dotted envelopes are the representative-CCF three-parameter theory; the orange dashed curve and band are the frozen E077 stratum-hybrid mean and partial-width bridge.
The horizontal lines are the ΔC values corresponding to ν = 3 and DET_ML = 6 and 10 from scalar incomplete-gamma math; they were not used to truncate the sample.
Figure B
Download PDF
Cell-by-cell comparison of mean(ΔC) and residual σ(ΔC)
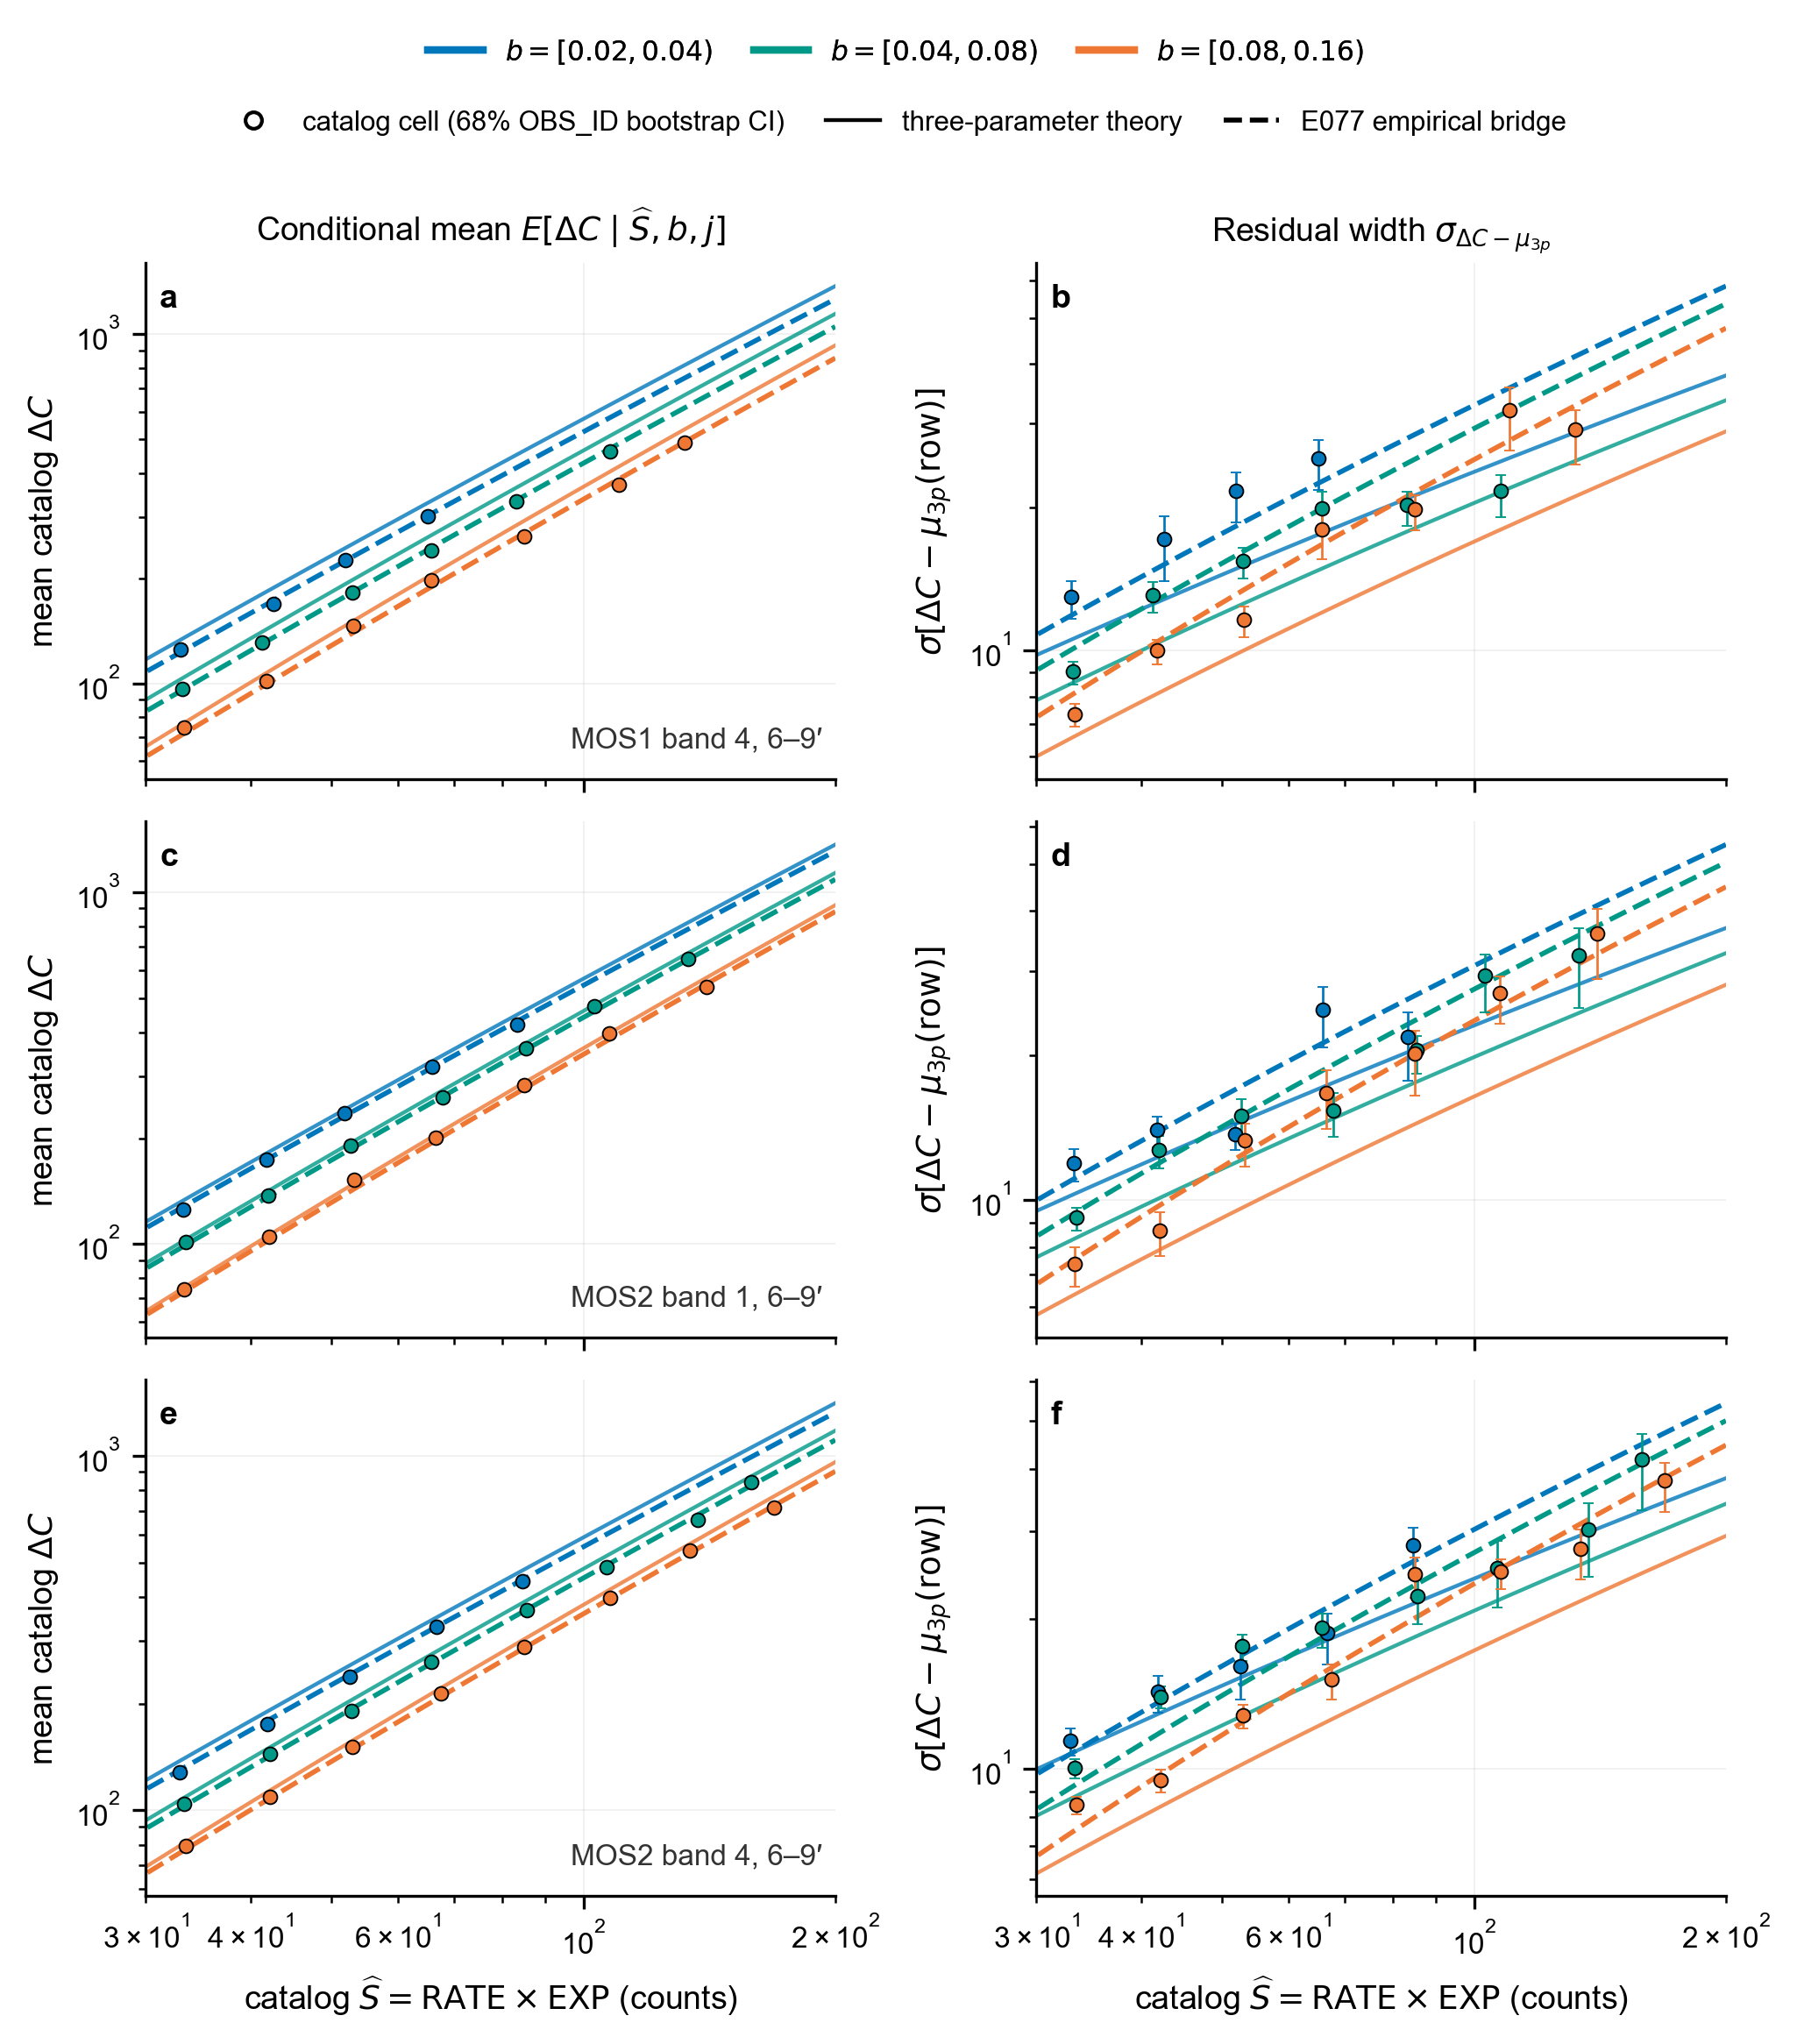
The three rows are M1 band 4, M2 band 1, and M2 band 4; colors denote three predefined factor-of-two background bins. Points use common, non-overlapping 0.10 dex counts bins; every point contains at least 20 sources and 8 distinct OBS_ID values. The upper panels compare conditional means; the lower-panel width statistic is std[ΔC − μ3p(row)], after removing the counts/background theoretical gradient source by source, and is therefore not the raw std(ΔC) within a narrow cell.
Mean and width error bars are central 68% percentile CIs from 4,000 deterministic non-parametric OBS_ID cluster-bootstrap resamples. The mean bootstrap fixes the observed rowwise μ3p design and resamples only the residual mean; the width is recomputed as the residual standard deviation for each resample.Intervals may be asymmetric, do not require residual is Gaussian,and do not treat rows within one OBS_ID as fully independent.
The bootstrap quantifies finite-sample uncertainty for the current detected-catalog cells only; it does not include catalog-selection uncertainty. These finer cells are display-only, do not refit the E077 coefficients, and are not pseudo-independent points from overlapping sliding windows.
Frozen full-sample fit
Catalog empirical bridge formula
μcat,j = κμ,j μ3p + 0.9281 + 1.3793 log10(b / 0.08)
σcat,j = √V3p [κσ,j + 0.5329 log10(CTS / 50) + 0.1768 log10(b / 0.08)]
| Stratum | κμ | κσ |
|---|---|---|
| M1 · band 4 | 0.9181 | 1.3003 |
| M2 · band 1 | 0.9574 | 1.2504 |
| M2 · band 4 | 0.9403 | 1.1749 |
CTS ≡ RATE × EXP; b is the catalog background in cts/pixel. Here μ3p and V3p comes from the representative-CCF three-parameter theory; j denotes the camera × band × θ stratum.
Interpretation boundary
What these figures do and do not support
What can be read
Within the displayed M1/M2, θ, background, and CTS ranges, the empirical bridge clearly improves the catalog conditional mean and partially corrects the residual width.
What cannot be extrapolated
The catalog itself has undergone joint detection-pipeline selection. The width mixes the source population, variable sources, residual geometry, and catalog selection; it is not a single-source error and is not evidence for a Gaussian tail.
Explicitly not covered
The empirical curves are not extended to CTS < 30; this page makes no claim about bright-source behavior at CTS ≥ 200 and does not read or analyze PN.